 StrideReplay
Sample report · MotionMetrix lab session
Sample running gait analysis report
Explore a measured treadmill run at 10 km/h, with a runner profile, two-view skeletal replay, stride metrics, and left and right gait curves.
- Capture
- Treadmill
- Speed
- 10 km/h
- Pace
- 6:00 min/km
- Lab setup
- Two camera views
Runner type
Long Strider
29% profile match
The strongest of six MotionMetrix profile matches for this treadmill session.
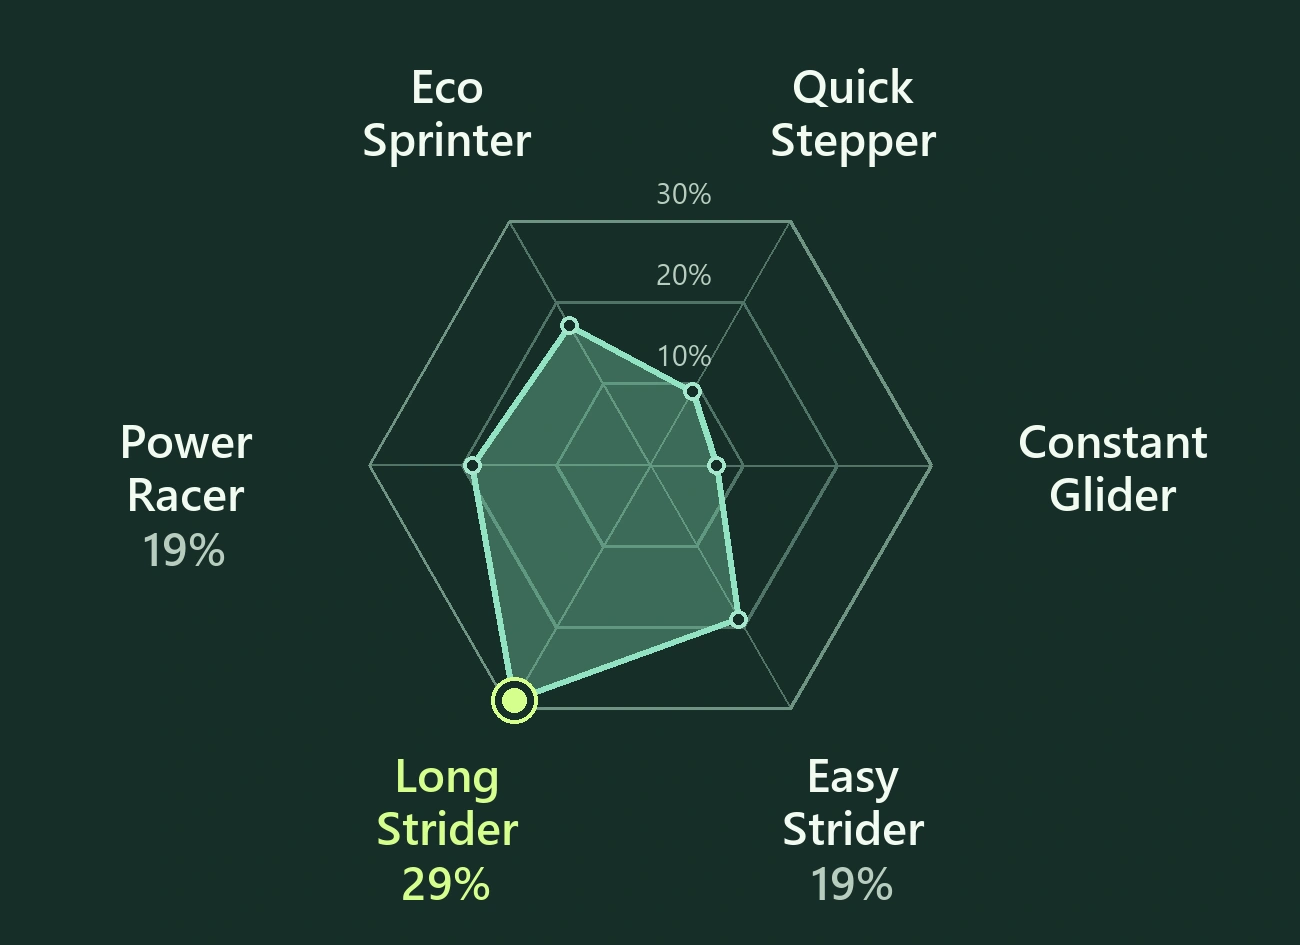
View original MotionMetrix chart
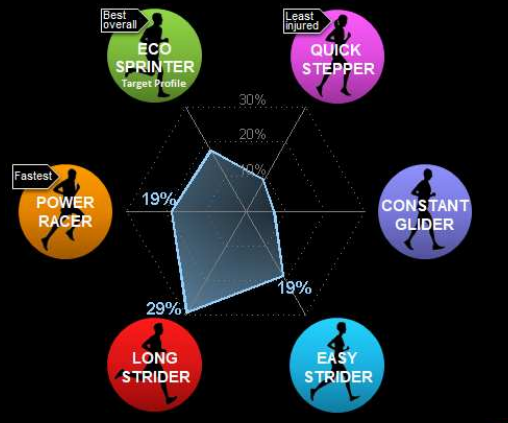
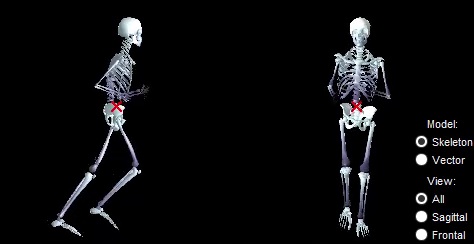
Running replay
15 seconds of skeletal motion reconstructed by MotionMetrix from the recorded treadmill run.
Findings
-
157 steps per minute at 10 km/h
The lab also reported 312 ms of ground contact and 58.3 mm of overstride.
See the stride metrics -
6.3° of forward trunk lean
This is the session value. The side view shows the runner’s posture in motion.
See the replay frame -
5.1° difference in peak knee flexion during swing
The left knee reached 80.0° and the right reached 85.1° during the swing phase.
Compare both legs
Coaching tip
Try slightly quicker, shorter steps
On a short repeat at the same easy pace, let your feet turn over a little quicker. Compare cadence and where your foot lands using the same filming setup.
Stride metrics
- Cadence
- 157 steps/min
Number of steps taken per minute.
- Ground contact time
- 312 ms
Time a foot spends in contact with the belt during stance.
- Forward trunk lean
- 6.3 °
Forward angle of the trunk relative to vertical.
- Overstride
- 58.3 mm
Forward landing distance reported by MotionMetrix at touchdown.
- Vertical displacement
- 88.6 mm
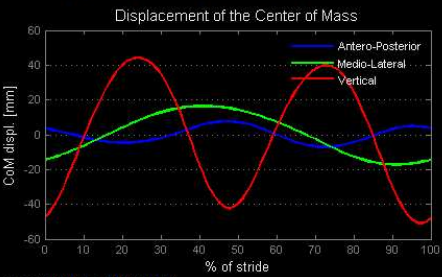
Vertical excursion of the estimated center of mass.
- Step separation
- 100 mm
Side-to-side spacing measured in the frontal plane.
Evidence frame
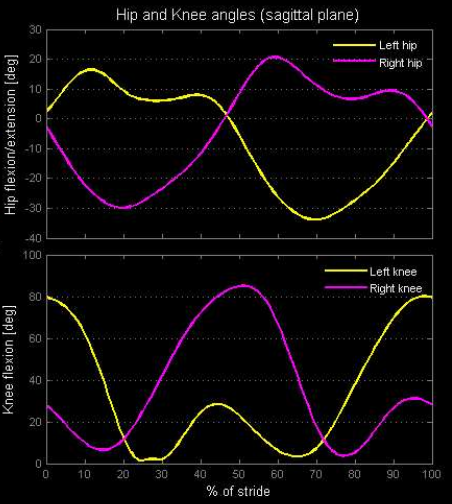
Gait-cycle curves
These are the original MotionMetrix curves. The horizontal axis covers one complete stride from 0% to 100%.
Hip and knee angles
Center-of-mass displacement
Left and right by gait phase
| Measurement | Mean | Left | Right |
|---|---|---|---|
| Maximum thigh flexion | 18.6° | 16.4° | 20.7° |
| Maximum thigh extension | 31.9° | 33.8° | 29.9° |
| Shank angle at touchdown | 1.5° | 2.1° | 0.9° |
| Knee flexion at touchdown | 5.0° | 4.2° | 5.9° |
| Peak knee flexion in stance | 29.9° | 28.5° | 31.2° |
| Peak knee flexion in swing | 82.6° | 80.0° | 85.1° |
| Frontal-plane knee alignment at midstance | — | −2.6° | 0.1° |
Additional MotionMetrix estimates
- Mechanical running economy
- 3.20 J/kg/m
- Elastic exchange
- 25.0%
- Peak vertical force
- 2.31 × body weight
- Peak braking force
- 0.07 Fv
- Peak lateral force
- 0.051 Fv
The force and economy values are model estimates from the lab report. Fv is the vertical force reference used in the source report.
About this session
MotionMetrix produced the session measurements, charts, and skeletal replay. StrideReplay presents those lab results here as a sample and adapts the source report’s coaching cue.
StrideReplay’s on-device analysis currently offers opt-in cadence and 2D trunk lean estimates for supported clips in the internal beta.
Read the filming guide